How to Activate Debug Mode for Firebase Analytics?
In Flutter, debug mode is set up for firebase analytics. Of course, it uses the emulator or simulator for choosing the debug mode for mobile apps. It will explore more options and find debugging options with firebase analytics for Flutter. Debug model permits users to set outsources level debugging using Flutter apps. Flutter easily connects with web apps and deploys the debugging tools forever.
How to enable debug mode for firebase analytics for a Flutter?
In this blog, you can learn how to enable debug mode for Flutter. A compilation optimizes well for fast development, and run cycles depend on the assertions. The debug mode for mobile apps is meant for supporting source-level debugging.
Professional Flutter engineer will show you how to enable debug mode for firebase analytics within short steps. It will easily connect to the process by delivering fast development, and debugging is also allowed.
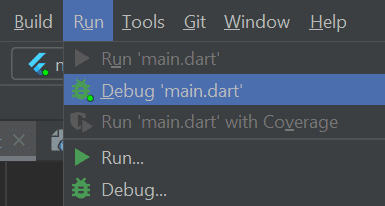
The built-in process must be optional to take the dartdevc compiler with easy debugging. By default, Flutter runs effectively on debug models. The IDE supports this mode and takes a pledge on the green bug icon overplayed with a small triangle on the project page.
Run>Debug…..menu option to choose to debug mode.
Set-up
Enabling debug mode with firebase analytics for Flutter is straightforward. The process is well described in the documentation and repeats the set-up code. They will track it completely by noticing page views as a sample.
Firebase Analytics analytics=FirebaseAnalytics();
MaterialApp(
home: MyAppHome(),
navigatorObservers: [
FirebaseAnalyticsObserver(analytics: analytics),
],
);
Problem
The problem in enabling the debug mode for Firebase analytics is easy to clarify. It will determine the exact solution by taking a screen view and events in the dashboard.
There is something extraordinary about named routes by focusing on implementing FirebaseAnalytics Observer. The sendScreen view for each navigation will note the default name extractor which determines the screen name.
If it resolves, the null value should implement and not even get logged. It considers default name extractors for pretty many considerations for Route settings. It will develop a navigation example by focusing on ScreenName and Route settings.
Solution
The solution is pretty much simple and effective as well. It uses something better and aims to supply instant solutions for navigation purposes. The extra tip must initiate well and be reliable to focus on debugging options.
Debug mode for Firebase analytics must be assigned well and reliable for debugging purposes.
Android
- To enable the Analytics Debug mode on Android, it also executes the standard line.
- adb shell setprop debug.firebase.analytics.app It considers an effective model and executes by focusing on the command line by focusing on explicit options.
- adb shell setprop debug.firebase.analytics.app .none.
iOS
To enable analytics to debug mode on the development service, it will specify the command line argument in Xcode options.
FIRDebugEnabled
A behavior must explicitly enable the debug mode by specifying the command line argument.
1. Open Xcode
2. Select Product -> Scheme > Edit scheme
3. Select Run from the left menu.
4. Select the Arguments tab.
5. In the Arguments Passed On Launch section, add -FIRAnalyticsDebugEnabled.
6. -FIRDebugEnabled
Update #1
The answer for enabling debug mode in Flutter must depend on the params on Xcode with the sense of adding analytics-enabled options. It is applicable for noticing on Google service.info with analytics enabled functionalities.
Update #2
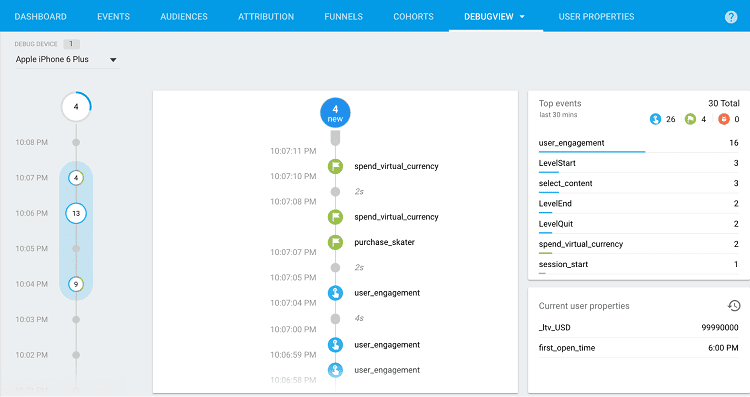
Debug view enables one to see the event data logged into app development services. In a real-time system, it is helpful for validation purposes on helping errors and mistakes. With analytics implementation, it works on user properties logged correctly.
Steps to enable debug mode for firebase analytics
1. Open your terminal
2. You go to your SDK → platform-tools → adb
3. To Enable the debug mode, we need to execute the following command.
adb shell setprop debug.firebase.analytics.app After successfully executing the
4. command, you will see the analytics events in DebugView (Firebase).
How to enable debug mode on request permissions?
Every application generally takes an exceptional outcome on showing enabled processes in debug mode. It must be applied to change settings about requestPermission() and onRequestPermissionResult() methods.
It will evaluate depending on the permission to get multiple runtime options. The functions are vital to managing and exploring strings representing the permissions with request parameters.
Debug mode in firebase analytics must identify well on real-time experience. It is helpful for validation purposes by focusing on development and discovering errors and mistakes. Proper analytics will be implemented based on the user properties with events.
Enabling debug mode
The process must identify them on battery and end-user to reduce network data usage. Debug mode in firebase analytics must set out a view report by focusing on the development device. However, it conserves end-users and implements changes uploaded together.
It considers analytics reports with minimal delay by focusing on-network data usage. It relies on the end users’ solutions with reduced network data usage.
Considers minutes stream options
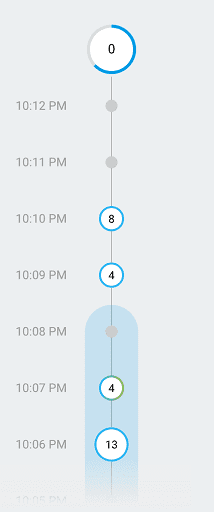
The second stream must be applicable to notice well in the last 60 seconds. It must be applied to ensure a good solution and cover within events on 30 min periods. The current user properties and selected development device. It shows a series of archives on events and focuses on second stream options.
start using your app to see your app’s events being logged in the DebugView report.
Seconds stream
By default option, it sees the events logged in 60 seconds. It even works well on the timestamp with corresponding options on the development device. Of course, you can click on an event to discover parameters on event associations forever.
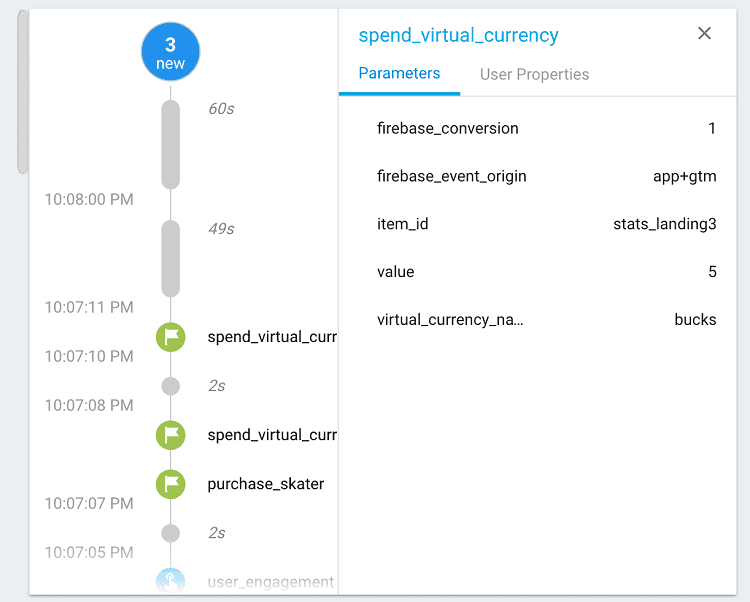
as user property value changes during app usage console get updated with new entry for that change.

Conclusion
Of course, enabling debug mode for firebase analytics for Flutter works significantly on given time. You must consult a Flutter development company like Flutter Agency to learn how to enable the debug mode for firebase analytics. A professional developer will guide you regarding debugging mode allowing for Flutter without hassle.
In this post, you can examine the debug mode for firebase analytics for Flutter for fine-grained detail. As a result, the user must identify well and focus on handling the debug mode for firebase analytics depending on the Flutter development.
Image Source: firebase.google.com
Get a Free Quote
Contemporary ventures
Recent blog
ready to get started?
Fill out the form below and we will be in touch soon!
"*" indicates required fields

