


How to Use CPU Profiler View in Flutter?
Currently, a vast majority of the worldwide population owns and uses a smartphone and mobile technology for various functions regularly. With advanced technological improvements, mobile apps are user-friendly solutions that provide high-performance benefits, like strong network connections and robust processing power.
The best mobile apps also come with an engaging user interface, owing to specific configurations that developers make during the app development process. One notable aspect that Flutter devs focus on to ensure sturdy app performance is the CPU profiler view.
It is compatible with mobile apps and Dart CLI only, so you should hire capable professionals from a top Flutter development company, like Flutter Agency. They are experienced in handling this process and carrying out the right steps. As for how the CPU profiler view works in Flutter, those details are available here.
What is a CPU Profiler?
It is useful to optimize the CPU usage of a mobile application in terms of getting a smoother and improved user experience. The app would work faster and lose a limited battery, ensuring better performance.
The CPU profiler is a solution technology experts use to analyze and test the CPU usage in an app carefully. It measures the real-time threat activity related to the app UI and interacting with it. Through the CPU profiler, it is possible to evaluate and check specific insights like recorded function traces, method traces, and system traces.
Flutter developers focus on using the CPU profiler view to record and then run Dart/Flutter-based session profiling.
The best experts at companies like Flutter Agency can accurately generate high-quality, and user-friendly profile builds that they use to study app performance. While the Flutter app works in profile mode, CPU profiles are suitable for release performance evaluation but not for any other session.
Recording Configurations for CPU Profiler View
Through the CPU profiler view, it is possible to see the records of interaction-based details. The type of information and its quality depends on the type of recording configuration that one chooses. Two main variations are available here.
Method/Function Traces
It is possible to use these configurations to check all threads of the app’s CPU usage and processing individually. One can acquire details through function traces and method traces to check what frameworks and coding languages are executed in the app for a specific time boundary. Plus, with these traces, developers identify the callees and callers.
The callee is the function/method that another function or method invokes. On the other hand, caller refers to the method/function that carries out the invoking action.
Therefore, with these traces, it is possible to understand which elements contribute to most of the app usage load.
System Traces
This type of recording configuration acquires fine-grained information related to system functions. Through these insights, one can comprehend the interaction quality of the app with available system resources.
How to Use the CPU Profiler?
To operate the CPU profiler, you can press record to begin said action. After completing the recording sequence, one can hit Stop. The data that is collected via the VM is shown in Call Tree, Bottom Up, and Flame Chart Profiler views.
Call Tree Profiler View
This type of view showcases the CPU profile’s overall method trace sequence. The table for the call tree view displays a top-down format for the profile. So, developers can click on one method to expand it and show all callees. The main elements here include:
- Self-time: This records the total time for the code execution done in this profile view.
- Total time: In this section, the overall time to execute the primary code and the callee-based code periods are recorded here.
- Source: It shows the main file path available for the method’s call site.
- Method: The called method name.
Bottoms Up Profiler View
The top experts from any Flutter company would focus on the bottom-up CPU profiler view to see the bottom-to-up depiction table of the CPU profile. Here, all top-level methods shown on the table are the last call stack method for any CPU sample. Another term for them is leaf nodes.
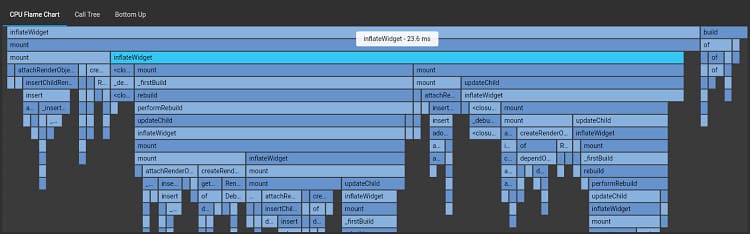
Flame Chart Profiler View
This profiler view format showcases the CPU sample representation for a specific period of the recording. It is accurate to view the stack trace here in a top-down manner. The stack frame at the top section invokes the stack frame under it.
Here, the width of any particular stack frame denotes the total time of CPU consumption of that stack frame. It is valuable to consider the stack frames that take up a high amount of CPU time. It is a better reference for checking any notable performance improvements.
Overall, the CPU profiler view is crucial to the Flutter-based app performance analysis and processing. We are a reliable Flutter Agency with experience and training in using CPU profilers for app usage evaluation. They carefully and quickly carry out the sequences, assuring top-notch results.
So, reach out whenever to book their valuable services for Flutter app development!
Frequently Asked Questions(FAQs)
1.Define the Flutter frames chart
This chart consists of the Flutter frame information for your application. Every bar set in the chart will represent a single flutter frame. Different color codes highlight various portions of the task when it renders a flutter frame. The flame chart will display the timeline events corresponding to the selected frame.
2.What is the call stack method in the Flutter framework?
When you are developing an application, it experiences a breakpoint, stops there, and the DevTools debugger will view the pause execution location in the source area. Additionally, the Call stack and variables areas are occupied with the current call stack for the pause isolate and the local variables for the selected frame. Opting for the other frames in the Call stack areas will modify the contents of the variables.
3.How does the frame class work in flutter projects?
There is a single stack frame in which every frame points to the precise location in a Dart code.

Contemporary ventures
Recent blog


Join our newsletter
Read and share new topics about all things Tech.
ready to get started?
Fill out the form below and we will be in touch soon!
"*" indicates required fields